More homes on the market usually means more sellers stepping in. This month, the math points somewhere else entirely.
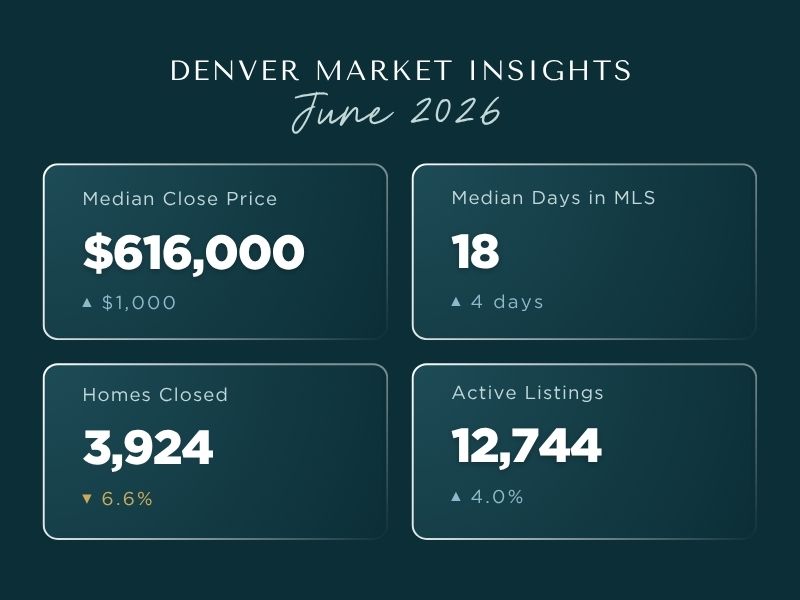
June closed out with a set of numbers that, read quickly, sound almost uneventful. Median close price moved a grand total of $1,000, landing at $616,000. Active listings ticked up 4 percent from May. Nothing here screams change.
On the surface, that inventory number tells a familiar story: more sellers decided it was time to list, so more homes showed up on the market. It’s the explanation that fits the season, and it’s the one most people will reach for without checking it.
Something different was afoot.
Closed sales fell 6.6 percent in June. New listings, the actual measure of sellers entering the market, fell too (down 4 percent from May). Inventory didn’t climb because sellers showed up. It climbed because buyers didn’t.
Inventory didn’t climb because sellers showed up. It climbed because buyers didn’t.
What the Numbers Don’t Show
Months of inventory is one of the more misleading-sounding numbers in real estate, mostly because of how it’s calculated: active listings divided by homes closed that month. Two completely different stories can push that number up: more homes for sale or fewer homes selling. The headline figure alone doesn’t tell you which one you’re looking at.
This June, we ran the math both ways. If closings had simply stayed flat from May, June’s rising inventory alone would have pushed months of supply up about 4 percent. If listings had stayed flat and only closings had slowed, that alone would have pushed it up roughly 7 percent. The actual number moved 11 percent, and the closings slowdown did nearly twice the work that new inventory did. This is a demand story disguised as a supply story.
There’s a second group of homes that the headline numbers miss entirely: the ones that never close at all. An estimated 2,581 Denver Metro listings expired or were withdrawn in June. For context, that’s roughly two homes pulled from the market for every three that actually sold. Sure, some of those sellers will relist or switch agents, and many may step away for the year. The data doesn’t give us their strategy, so it’s hard to convey the true story behind that number. But it’s consistent with a market where more listings are struggling to find a buyer than the closed-sales column alone would suggest.
Two Markets, One City
Detached and attached homes closed out June telling almost opposite stories. Detached homes closed at a median of $675,000, up $3,000 from May, moving at a median of 14 days. Attached homes closed at $391,750, down $750, and sat for a median of 34 days, which is more than double the detached figure.
The gap shows up even more clearly once you look past the homes that sold. Attached homes made up just 21 percent of June’s closed sales, but 35 percent of active inventory, and 38 percent of the listings that expired or were withdrawn. Needless to say, this market segment absorbed more than its share of this month’s slowdown.
Some of that comes down to what buyers are actually evaluating before they write an offer. It’s not just whether the furnace works, or whether the roof is currently doing its job. Buyers are asking how old those systems are. A ten-year-old furnace that’s still running fine gets treated differently than a two-year-old one, because a savvy buyer knows “still working” and “no expense coming” are two different things. The same logic applies to the roof, the water heater, every major system in the house. Attached homes, often carrying HOA-managed shared systems on top of everything else, feel that scrutiny first.
What the Leading Indicators Are Telling Us
Pending sales came in at 3,867, down 2.8 percent from May. New listings landed at 5,759, down 4 percent. Both numbers moved in the same direction they typically do this time of year. June has consistently been a month where buyer activity cools, in every year since 2023, while seller activity has stayed remarkably steady over that same stretch.
Don’t expect July to reverse that pattern. History says it won’t. New listings and pending sales have both trended down heading into summer for the past several years running, not just this one. The more useful thing to watch isn’t whether the dip happens, but how big it is. Each year’s summer pullback has been milder than the one before it, and if that holds, this year’s should be gentler still.
Mortgage rates are an important part of the backdrop. Most forecasts have rates holding in the 6-to-7-percent range for the rest of the year, nowhere approaching the dramatic relief some buyers are waiting on, but not a headwind getting worse, either. Buyers watching pending sales are watching the truest signal available: a home has to go under contract before it can close, and this number tells you what’s coming before anything else does.
The Affordability Conversation Worth Having
Nationally, home prices kept climbing through the spring. The Case-Shiller Home Price Index showed a 0.8 percent gain in April alone, on top of 0.7 percent in March. Denver didn’t follow. Our median close price is up less than 1 percent year over year, essentially flat against a national market that isn’t slowing down. That divergence is worth sitting with: Denver isn’t just having a quiet month, it ‘s underperforming the broader trend.
Some of that gap likely traces back to the local economy rather than the housing market itself. Denver’s population growth has slowed sharply over the past year, and the metro area has been shedding jobs on a year-over-year basis this spring. A national jobs report released this month came in well below expectations too, with unemployment ticking down only because people left the labor force, not because hiring picked up. None of that is a reason for alarm, but it helps explain why Denver’s demand has been softer than the national headlines would suggest, independent of anything happening with rates or listings.
The Bottom Line
June was a month where the number that moved (inventory) and the number that explains why (closings, not listings) told two very different stories, and only one of them was the obvious one.
The market isn’t flooding with new sellers, and it isn’t collapsing under a wave of buyer demand either. It’s specific. Detached homes in the right condition are still moving quickly. Attached homes, and any home carrying aging systems regardless of type, are absorbing most of this month’s hesitation. Broad statements about “the Denver market” will keep missing that distinction.
If you’re trying to figure out where your specific home, or your specific search, actually falls in that picture, we’d rather walk through the real numbers with you than let a headline do the talking. Reach out anytime.
Market data sourced from the Denver Metro Association of Realtors® June 2026 Market Trends Report. Data provided by REcolorado. Expired/withdrawn listing figures sourced separately via REcolorado MLS.
We love sharing thoughtful perspectives on home, place, and everyday living. If this sparks a question or curiosity, we’d always be glad to connect and continue the conversation here.