The headline number looks strong. The details tell a more complicated story. Here’s how to read both.
May was a month that looked one way on the surface and told a more complicated story underneath. That’s not unusual for Denver. But this month, the gap between the headline and the reality is wide enough to be worth understanding carefully.
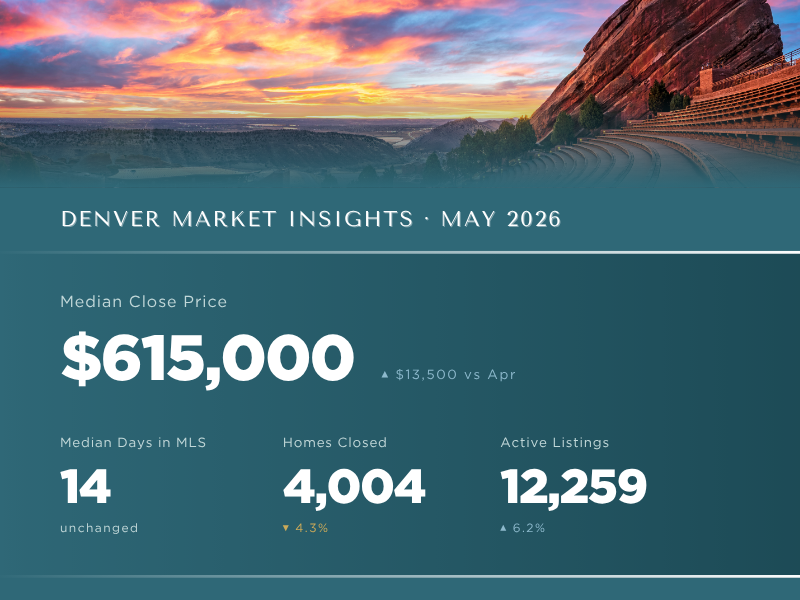
The median close price reached $615,000, up $13,500 from April and 2.5% above May 2025. Homes that went under contract moved at a median of 14 days, which was identical to April, and still among the faster paces we’ve seen in recent years. On those two measures alone, you might conclude that the market is healthy and humming.
Then you look at closed sales, and the picture shifts.
4,004 homes closed in May, down 4.3% from April and nearly 7% below May of last year. Active listings grew to 12,259, up 6.2% from the month before. More homes available. Fewer homes selling. Prices still rising. That combination deserves more than a headline.
More homes available. Fewer homes selling. Prices still rising. That combination deserves more than a headline.
What the Numbers Don’t Show
Every monthly market report measures the homes that made it to the finish line. Median price, days in MLS, and closed sales are all trailing metrics. They reflect decisions that buyers and sellers made four to six weeks ago, in many cases before May even began.
What they don’t capture are the homes still waiting. The listings that have been on the market for 45 days with little to no showings. The sellers who reduced their price and are still waiting. Those homes aren’t in the averages, but they’re in the market.
Here’s the important nuance: inventory is growing not because a wave of new sellers is entering the market, but because homes are taking longer to sell. New listings actually fell 9.5% from April. Fewer sellers are coming in. The homes already there are simply sitting longer. That’s a different story than “inventory is surging,” and it matters for how you interpret the number.
Two Markets, One City
The detached and attached segments are no longer telling variations of the same story. They are telling fundamentally different ones.
Detached homes closed at a median of $675,000, up $10,000 from April, and moved at a median of just 11 days. Demand for well-located, well-priced single family homes remains real and consistent. Attached homes (condos, townhomes, and similar properties) closed at $395,000, also up $10,000, but sat at a median of 29 days. Attached closings fell 12% from April month over month and are down 18% year over year.
That gap is widening, not closing.
Part of what’s driving it is something that doesn’t show up cleanly in any single data point: buyers are thinking about total cost of ownership in a way they haven’t before. It’s not just the purchase price or the monthly mortgage payment. It’s the HOA fees, the insurance premiums, the age of the roof, the HVAC system that’s twelve years old and technically has useful life remaining but will need replacement within a few years. Buyers in today’s market are doing that math before they make an offer, not after.
This is why “detached sells fast, attached struggles” is only part of the picture. A detached home with deferred maintenance and aggressive pricing is sitting just as long as a struggling condo. Location, condition, pricing, and total cost of ownership are now the variables that determine speed, not home type alone.
What the Leading Indicators Are Telling Us
Most market data looks backward. But two numbers give us a window into what’s coming.
Pending sales came in at 4,134, up 1.2% from April. Pending sales typically close within four to six weeks, which means they’re the most reliable signal we have for what June closings will look like. A steady May on this measure suggests June should hold near current levels, barring any meaningful shift in interest rates.
New listings fell 9.5% from April to 6,006. Fewer sellers entering the market now means the inventory growth you’re currently seeing is likely to slow as we move through June and into July, with less new inventory to choose from as the summer progresses. How different that supply picture will look by late summer will depend in part on seller patience. Homes that aren’t finding buyers have three paths: reduce and adapt, sit tight and hope for the best, or withdraw from the market entirely. If sellers grow frustrated and pull listings rather than adjust, active inventory could shrink faster than the new listing numbers alone would suggest.
Pending sales are the market’s most honest signal. A home has to go under contract before it can close. Watch this number and you’re watching the future, not the past.
The Affordability Conversation Worth Having
You may have seen headlines recently calling Denver one of the fastest-declining home value markets in the nation. Those headlines were based on a single year-over-year comparison from February that, without context, told a misleading story. Denver’s median close price has grown at roughly 6% annually for nearly a decade. That’s not anomalous. That’s the market’s historical norm.
What has changed is the cost of financing. The DMAR Market Trends Report put it plainly: a buyer who purchased at the median price in March 2020 with a 3.8% rate carried a monthly payment around $1,866. At today’s median of $615,000 with a 6.5% rate, that payment is closer to $3,498. Of that roughly $1,600 monthly difference, about $714 comes from price appreciation. The other $918 comes from the rate increase.
Rates are a bigger affordability driver than prices. That’s not a reason for optimism or pessimism. Instead, see it as simply the most accurate way to understand the challenge. And it points to where the real opportunity lies for buyers who are ready to move: rate buydowns, seller concessions, and the long-term math of refinancing when conditions change are all more productive conversations than waiting for a price correction the data doesn’t support.
The Bottom Line
May was a month where the headline number (prices up) and the underlying reality (fewer closings, slower movement in attached homes, inventory growing for the wrong reasons) pointed in different directions. That kind of divergence is exactly when context matters most.
The market is not collapsing. It is not uniformly strong either. It is specific. The homes that are priced correctly, presented thoughtfully, and located where demand is real are still moving with purpose. The ones that aren’t are sitting, and sitting longer than sellers expect.
The data tells you where the market has been. Local knowledge tells you where it’s going. If you’re trying to figure out what any of this means for your specific situation, we’re always glad to think it through together.
Market data sourced from the Denver Metro Association of Realtors® May 2026 Market Trends Report. Data provided by REcolorado.