July’s median price broke a five-month climb. Here is (and what isn’t) driving it.
Market Insights by Nick DiPasquale | August 10, 2026
I just returned from a week on the East Coast this past Saturday. It was Martha’s Vineyard, my in-laws, lobster (and other seafood), and more saltwater than Colorado will ever give me.
One morning on the beach, I found myself staring into the water. The waves weren’t moving in harmony. Some broke fast, some broke slow, they broke into each other and over each other, sometimes overpowering the retreating water and other times being negated by that same retreating water. I was on vacation, but staring into the water made me think about Denver real estate.
July’s numbers looked a lot like that stretch of water. There were a few big, obvious movements everyone will notice, and a lot happening underneath and around them that’s easy to miss if you’re only watching the surface.
A Five-Month Climb Just Broke
If there was one question I heard more than any other this year, it was “when will prices come down?” The month-to-month increases didn’t seem sustainable given the other market indicators. Well, we finally got our answer.
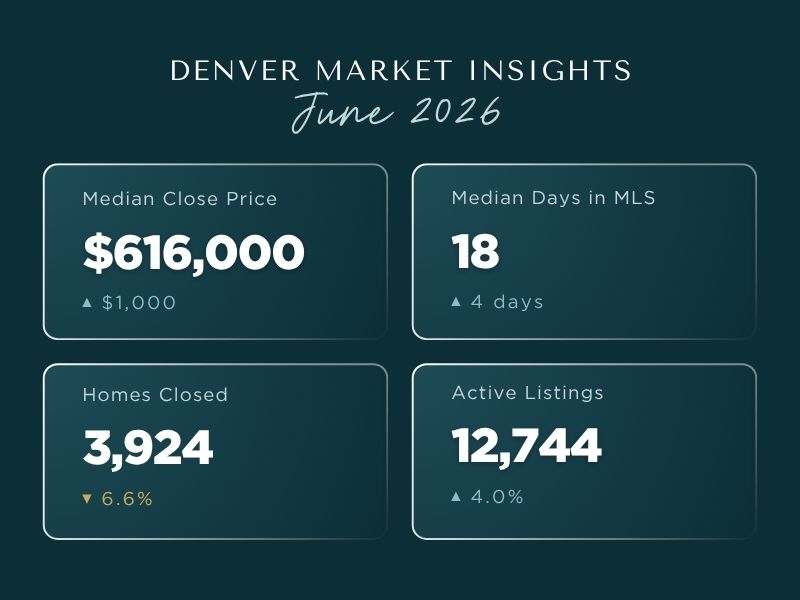
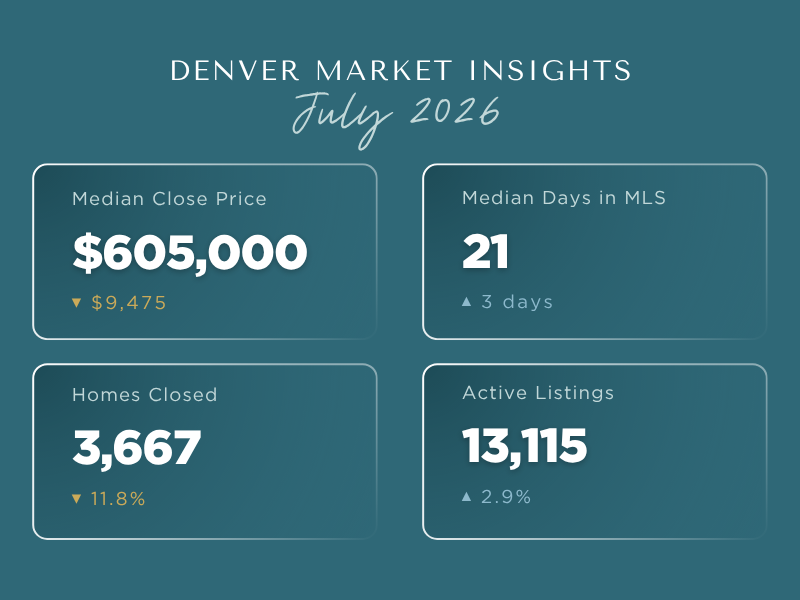
Denver’s median close price came in at $605,000 in July, down $9,475 from June. That breaks a five-month climb that started at January’s $568,750 low and ran all the way through June’s $614,475 high.
The rest of July’s numbers point the same direction. Homes sat a median of 21 days, up from 18 in June. Closings fell nearly 12 percent. Active listings kept building, up 2.9 percent. Put together, that’s a market handing buyers a little more room and sellers a little more anxiety.
Sellers and buyers pulled in opposite directions all summer. New listings dipped 5.3 percent from June, which is normal this time of year, but they’re still up from last July. It’s the fourth summer running that’s happened. Pending sales fell both from June and from last July, a streak that hasn’t broken once since 2023: a few more sellers list each July, while fewer buyers commit.
Months of inventory (how balanced supply and demand are) landed at 3.58, almost exactly where it sat a year ago (3.60). It’s been a steady climb since March. If previous years are any indication, and they typically are, the upward trend is one that will likely continue as the year plays out.
Unlisted Homes Just Hit a 2026 High
Closings and median price only tell you about the homes that made it across the finish line. They don’t tell you about the ones that didn’t.
Homes pulled off the market before selling jumped 40.7 percent in June, then climbed another 10.7 percent in July to reach 2,099. It’s the highest total of the year, and roughly 85 percent above where unlisted homes were in April. Normally, we see spikes in unlisted homes right on December 31 and January 1, when a wave of listing agreements all expire at once. Seeing it build for months in the middle of summer is different, and it’s a real signal for how sellers are being forced to respond to this market.
The data doesn’t tell us every seller’s story. We can’t see exactly why someone pulls a listing. Maybe it’s a price reset, a change in agents, a misread of the market, or life circumstance that made the timing wrong for them. What we can see is that attached homes made up 45 percent of July’s unlisted homes, despite being only about 35 percent of active inventory.
Worth noting: this isn’t a read unique to us. A similar look at what closing data leaves out showed up in the Denver press within the same week we were building this report. When more than one person independently starts asking the same question about the same gap in the data, that’s usually a sign the gap is real.
One Segment Is Absorbing Most of the Slowdown
Detached homes sold in a median of 17 days, with just under three months of supply, slightly leaning to a seller’s pace. Attached homes sat a median of 40 days, more than double, with close to six months of supply, squarely buyer’s-market territory. Attached median price slipped to $380,000, down both from June and from a year ago. Detached, on the other hand, held at $660,000, up modestly year-over-year.
The gap extends beyond how long homes sit. It shows up in the whole shape of each market. Attached homes made up 22 percent of July’s closed sales, 35 percent of active listings, and 45 percent of the homes withdrawn from the market entirely. Each number climbs as you move from what’s selling to what’s sitting to what’s giving up.
Inventory is even moving in opposite directions by property type: detached active listings are down 11.6 percent year-over-year, while attached listings are up 5.7 percent over that same stretch. Sellers of attached homes are facing more competition than they were a year ago. Sellers of detached homes are facing less.
It’s the same lesson from that stretch of beach I found myself on: no two waves break the same way. The number that describes Denver overall is real. It just rarely describes the deal you’re actually working on.
It’s Not Just the Rate
It’s tempting to make the affordability story only about the interest rate. There’s more to it.
A buyer weighing an offer isn’t just running mortgage math. They’re doing it against rising grocery bills, insurance premiums, and every other cost that’s crept up right along with it, so the same monthly payment feels heavier than it would have a few years ago, even at an identical rate. That’s a big part of why first-time buyers are getting pushed further out or sidelined, and why move-up buyers are holding onto mortgages they locked in years ago, even when their current home doesn’t fit anymore.
None of this means buyers have left. It means the bar for “worth it” has moved, and sellers who understand that are the ones finding success in this market.
The Bottom Line
Back on that beach, what struck me most wasn’t any single wave, it was how many different things the water was doing at once, all in that little stretch of shoreline. That’s Denver’s market right now. Price finally broke its five-month climb, and the tide went out for the first time all year. Withdrawn listings kept climbing underneath it, creating its own undertow. And depending on which segment you’re standing in, the water either barely moved, or it’s pulling hard in one direction.
That’s the piece worth remembering above the rest: there’s no single Denver market to time. There’s a detached market and an attached one, different price points and different neighborhoods, each moving at its own pace, and the leverage you have depends entirely on which one you’re standing in.
Keep to your own timeline, and have a strategy for whatever the market does while you’re standing in it. If you’re wondering how any of this plays out for your specific situation, that’s what we’re here for. Just ask.
Market data sourced from the Denver Metro Association of Realtors® July 2026 Market Trends Report. Data provided by REcolorado. Withdrawn/expired listing figures sourced separately via REcolorado MLS.
We love sharing thoughtful perspectives on home, place, and everyday living. If this sparks a question or curiosity, we’d always be glad to connect and continue the conversation here.